Group
Group
In Formatting Property click on Series Property.
Enter Following details in Group Property:

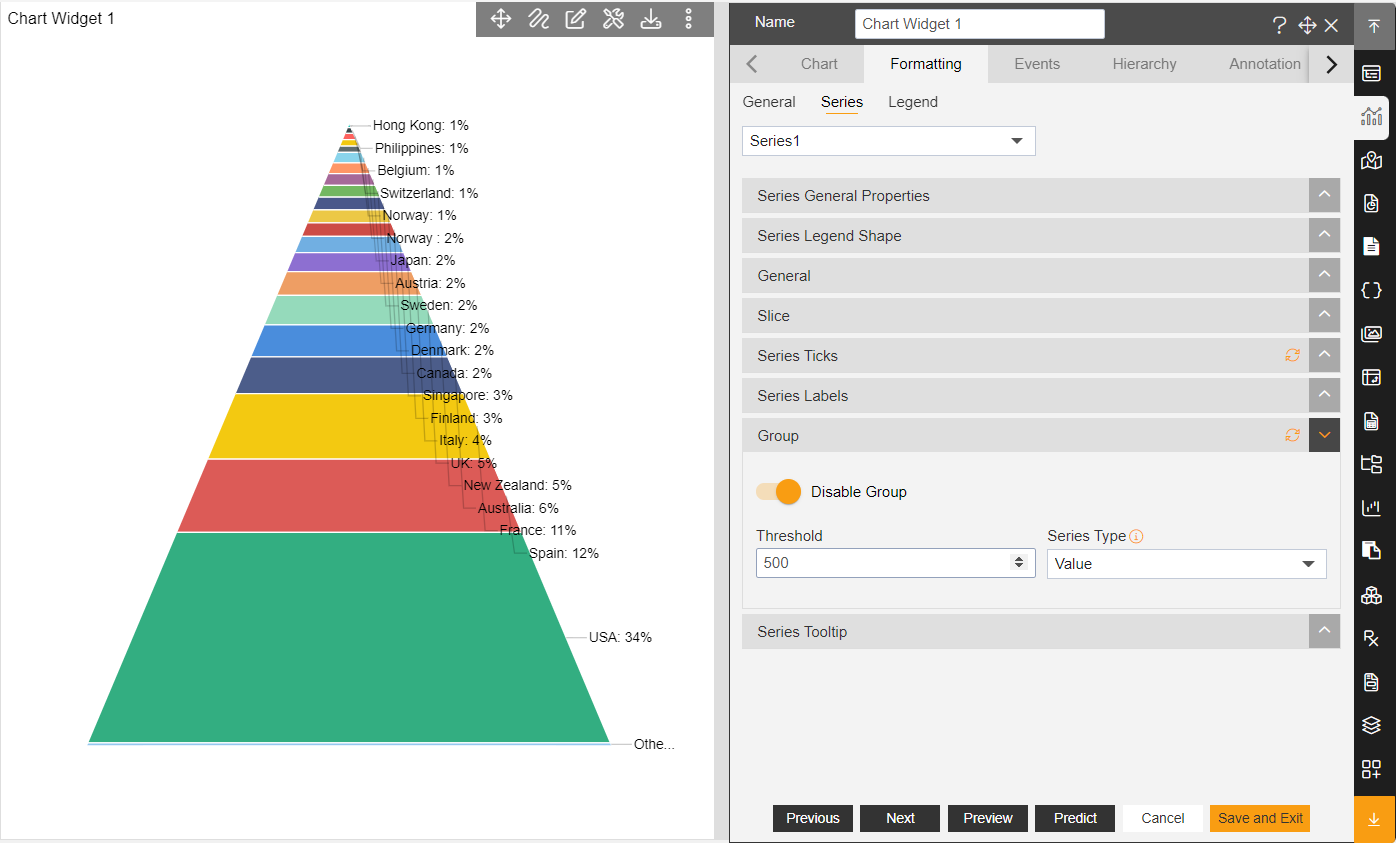
Group used in pyramid chart to make group of values available in pyramid chart, user can control the number of groups to visualize in widget.
As User enable the group using the toggle button, its menu gets appear.

The Threshold is used to control the number of pyramid slices in chart widget.
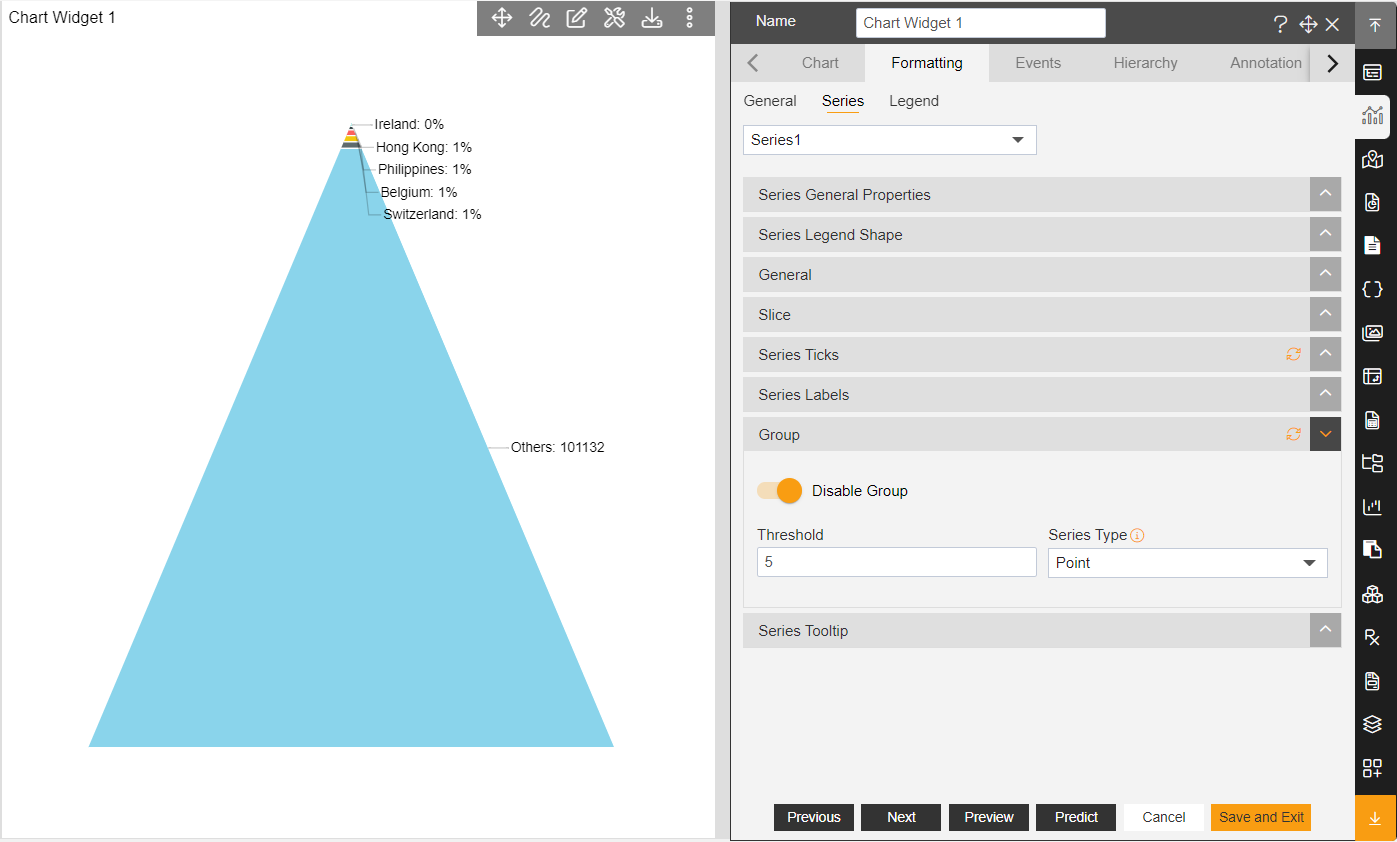
Series Type: It has two series type like points and values.
Point Series Type: The point use for how much points of threshold should be visible on chart. If user add 5 then it takes 5 slices for visualization and take other to the group. as shown in figure below:
- Values Series Type: The value use for how much values of slices should be visible in chart.